
Key finding: India’s travel peaks are not flattening. Across 51 destination and trip-planning searches, the gap between the three busiest and the three quietest months was 1.37 to 1 before the pandemic (October 2016 to September 2019) and 1.36 to 1 in the four most recent travel years (October 2022 to September 2026). What has moved is the calendar. May and June lost share of the year’s travel searches, from 19.9% to 18.8%, while November to January gained, from 25.4% to 26.9%. For snow and high-altitude trips, December is now close to a second peak, with its seasonal index up from 103 to 135 while May and June fell. The quietest months did not fill in. “Shoulder season” in India is better described as a new winter peak than as a flatter year.
This article measures attention to travel, not visits, bookings or revenue. It cannot measure 2027, which has not happened. It asks a narrower question: up to September 2026, is there any sign that the seasonal peaks in Indian travel interest are levelling out? The answer the data supports is “not yet, and not evenly”.
Quick Navigation
What was compared
We built a month-by-month seasonal index for 51 searches made in India, grouped into eight trip types: hill station (8 searches, such as Manali, Munnar and Darjeeling), snow and high altitude (7, such as Spiti Valley, Gulmarg and Auli), beach (6), wildlife (6), heritage and desert (6), pilgrimage (6, such as Char Dham Yatra and Vaishno Devi), monsoon and backwater (6) and general trip planning (6, such as “tour packages” and “hotel booking”). Each search is scaled to its own annual average, so a month scoring 120 is 20% above that search’s own typical month. We then compared two periods using travel years that run from October to September, so that the winter, summer and monsoon seasons (the monsoon runs June to September: India Meteorological Department, no date) each sit inside one year: three before the pandemic (October 2016 to September 2019) and four recent ones (October 2022 to September 2026). The three travel years from 2019-20 to 2021-22 are left out because lockdowns distort them.
Two measures carry the analysis. The peak-to-trough ratio is the average of a trip type’s three highest months divided by the average of its three lowest. It is the same kind of ratio that Eurostat uses when it reports that EU residents took 2.5 times as many trips in the peak month (August) as in the lowest (January) in 2024 (Eurostat, no date), although ours is measured on search interest, not trips. The peak-month share is the percentage of a year’s interest that falls in the three months that were busiest before the pandemic, held fixed so that we can see whether they lost ground. We call the six months between peak and trough the shoulder months and the three lowest months the trough.
Finding 1: The peak-to-trough ratio has not moved
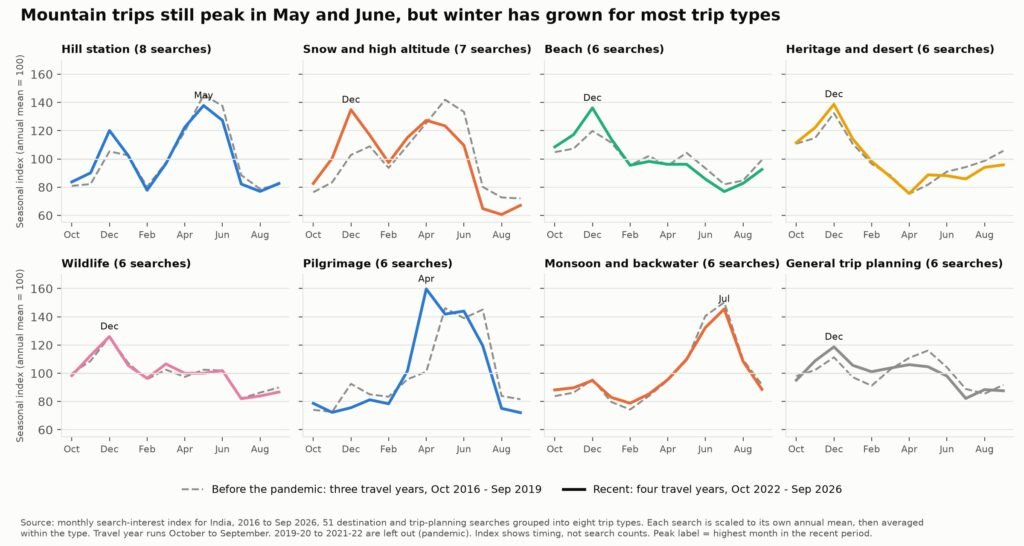
Month-by-month index by trip type
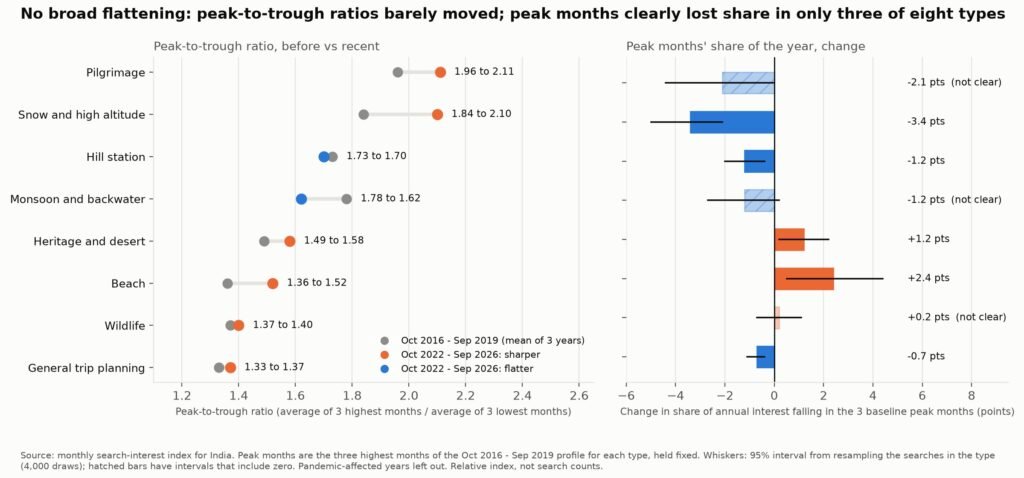
Pooling all 51 searches, the ratio was 1.37 before the pandemic and 1.36 recently, a change of -0.01 with a 95% interval of -0.07 to +0.09, so there is no measurable flattening. The seven travel years individually range from 1.31 to 1.42, and the latest, October 2025 to September 2026, is the lowest at 1.31, just under the 1.33 to 1.42 range of the other six. One year is not a trend, and beach and heritage searches had their sharpest years in that same period (1.80 and 1.82).
By type the picture is mixed rather than uniform.
Peak-to-trough ratio and peak-month share
Pilgrimage searches have the sharpest seasons (ratio 1.96 before, 2.11 now) and snow and high-altitude trips are next (1.84 to 2.10). Beach (1.36 to 1.52) and heritage and desert (1.49 to 1.58) became somewhat sharper. Hill station (1.73 to 1.70), wildlife (1.37 to 1.40) and general planning (1.33 to 1.37) did not move. Only monsoon and backwater trips flattened by a visible margin (1.78 to 1.62), and its interval, -0.28 to +0.06, includes zero. Intervals come from resampling the searches within each type, and with six to eight searches per type they are wide. The peak months’ share of the year agrees: it fell clearly for snow and high altitude (-3.4 points), hill station (-1.2) and general planning (-0.7), and rose clearly for beach (+2.4) and heritage (+1.2).
Finding 2: Official arrivals data show a similar picture
Search interest is a proxy, so we checked it against official monthly counts. The Ministry of Tourism publishes month-by-month foreign tourist arrivals and departures of Indian nationals (Ministry of Tourism, 2025). Using the same three-highest over three-lowest ratio, foreign arrivals were 1.64 in 2019, 1.54 in 2023 and 1.57 in 2024. December was the peak and May the trough in all three years, and November to January held 31.4% of arrivals in 2019 and 30.3% in 2024. That is a slightly flatter inbound year than 2019, but the winter peak is intact. Indian nationals’ departures abroad are close to flat all year, with ratios of 1.13 (2019), 1.19 (2023) and 1.18 (2024), and they became marginally sharper, not flatter. May is the busiest month for departures (9.5% of 2024’s total) and February the quietest.
We found domestic tourist visits only as annual totals in the Ministry’s compendium: 2,508.82 million in 2023 and 2,948.19 million in 2024, a rise of 17.5% (Ministry of Tourism, 2025). Domestic travel is where the search data matter most, because there is no official monthly series to test them against. We did not find one.
Finding 3: The calendar moved: summer lost share, winter gained
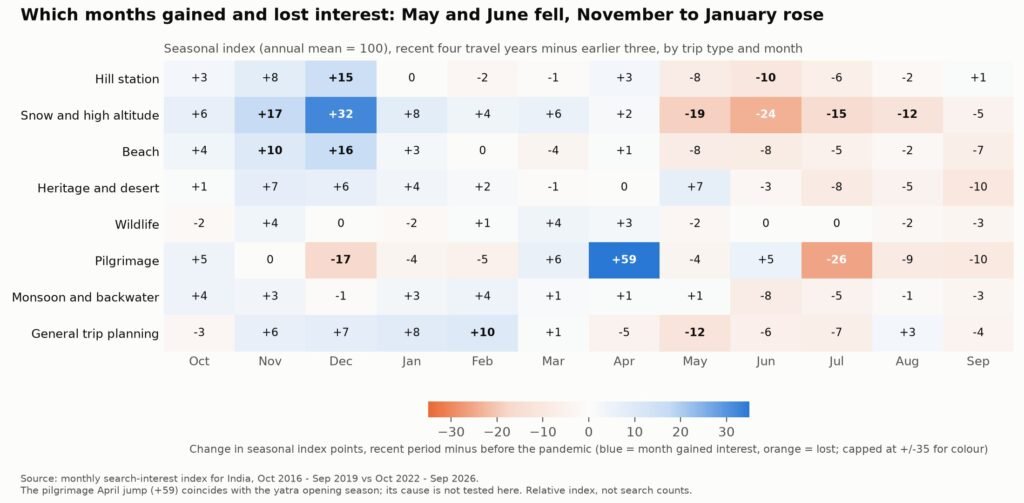
Change in seasonal index by month and trip type
Across all 51 searches, May and June lost 1.1 points of the year’s interest (95% interval -1.7 to -0.5) and November to January gained 1.5 points (+0.6 to +2.3). At the level of single searches, 37 of 51 lost May-June share and 39 of 51 gained November to January share. The biggest moves are in the mountains. For snow and high-altitude trips, the index fell by 19 points in May and 24 in June and rose by 17 in November, 32 in December and 8 in January. Hill-station searches kept their May peak (index 138) but lost 8 points in May and 10 in June and gained 15 in December. Beach searches gained 16 points in December and 10 in November.
Some changes are not about winter. General trip planning searches gained 10 points in February and 8 in January and lost 12 in May, a hint that people begin planning earlier, though this analysis did not test that. Pilgrimage searches jumped 59 points in April, while July fell by 26. This coincides with the yatra opening season, but we did not test the cause, and the shift may reflect when information about registration and opening dates is published rather than a change in travel plans.
Finding 4: What “shoulder season” really means here
If peaks were flattening, the six shoulder months would take a larger share of the year and the trough months would fill in. Neither happened broadly. The three trough months held 20.0% of hill-station interest before the pandemic and 19.9% now, 18.4% and 17.5% for snow and high altitude, and 21.7% and 20.4% for beach. The shoulder months gained share for snow and high altitude (48.2% to 52.4%), pilgrimage (45.1% to 47.6%) and hill station (46.5% to 47.8%), and lost it for beach (50.1% to 48.9%) and heritage (49.7% to 48.0%).
The reason is that, for mountain trips, the shoulder months as defined from the old profile include December and January, and those months have become a second peak. The recent December index is 135 for snow and high-altitude trips, 120 for hill stations and 136 for beaches. A traveller or operator reading “shoulder season” as a flat, quiet period between two peaks would be misled: the data describe a year with two humps, a summer one that is slightly smaller and a winter one that is larger. The troughs are still where they were: July to September for mountain trips, April for heritage, and February for monsoon destinations.
Finding 5: Where the shift shows up
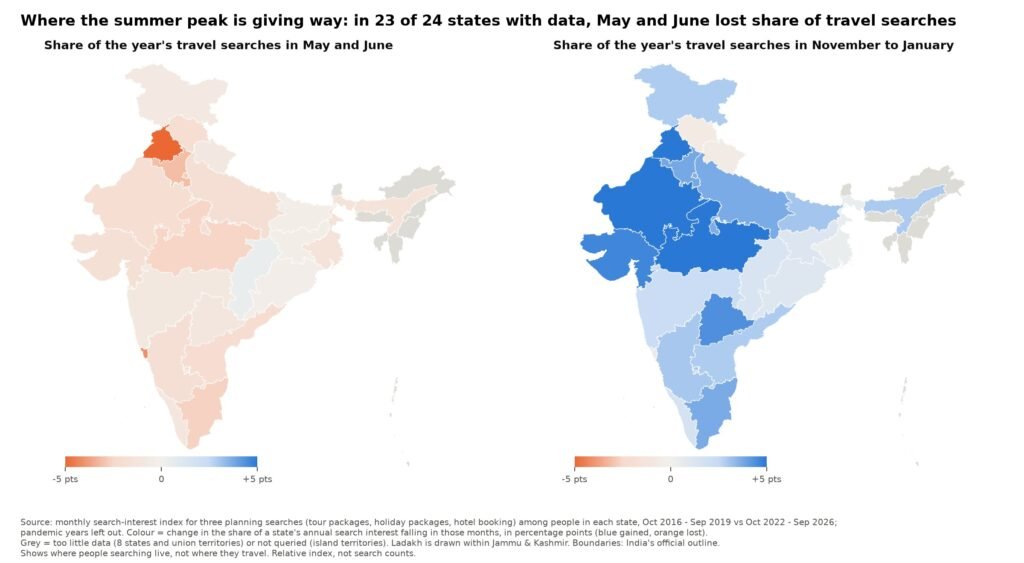
States where May and June lost share of travel searches
We repeated the test by the state of the person searching, using three planning searches (“tour packages”, “holiday packages” and “hotel booking”) in 24 states and union territories with enough data; eight others had too little. May and June lost share of annual travel-planning interest in 23 of the 24, the exception being Chhattisgarh (+0.4 points). The largest losses were in Punjab (-5.9 points), Goa (-4.1), Haryana (-3.1), Delhi (-2.8) and Tamil Nadu (-2.6). November to January gained share in 22 of 24, most in Punjab (+6.2), Madhya Pradesh (+5.1), Rajasthan (+5.0), Gujarat (+4.6) and Chandigarh (+4.4). The two exceptions were Himachal Pradesh (-0.7) and Uttarakhand (-0.6), so residents of the two Himalayan states keep a summer-heavy calendar. The map shows where people searching live, not where they travel. We did not map destinations. Individual state series are noisy, so the direction across 23 of 24 states is more reliable than any single value.
Finding 6: What people ask about timing
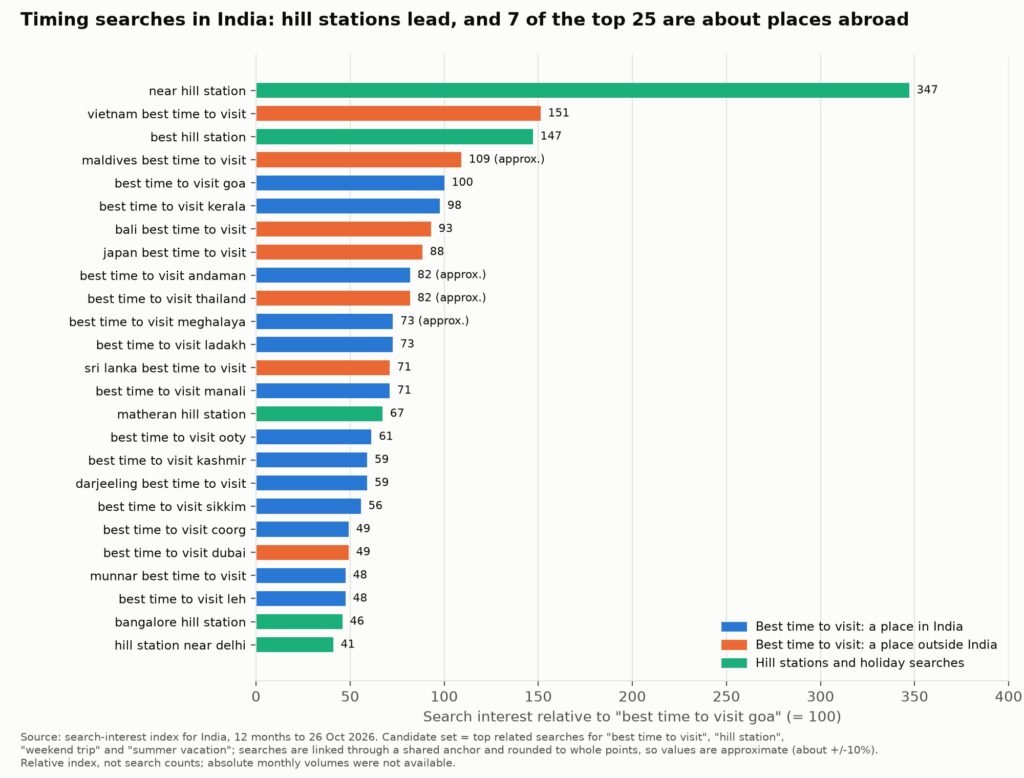
The 25 most-searched timing questions
The pitch promised the top 25 audience searches. We built a candidate set of about 35 timing and getaway searches from the top related queries for “best time to visit“, “hill station”, “weekend trip” and “summer vacation” in India, measured them against one anchor search (“best time to visit goa” = 100) over the 12 months to 26 October 2026, and kept the top 25. The generic “near hill station” scores 347, more than three times the anchor, and “best hill station” scores 147. Of the 25, 13 are best-time questions about places in India (Goa 100, Kerala 98, Andaman 82, Meghalaya 73, Ladakh 73, Manali 71) and 7 are about places abroad: Vietnam (151), the Maldives (109), Bali (93), Japan (88), Thailand (82), Sri Lanka (71) and Dubai (49). Five more are hill-station searches. Timing questions are therefore not only a domestic matter; the same readers are weighing a season at home against one abroad, and official departures data show those trips are spread more evenly across the year than inbound travel.
Finding 7: What the news is talking about, and which themes are rising or falling
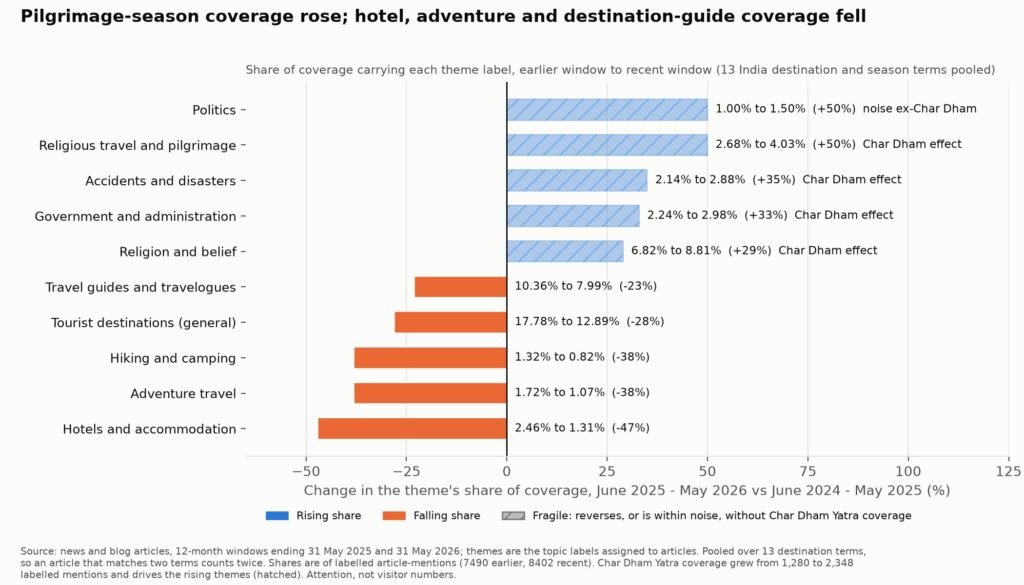
Rising and falling news themes
News and blog coverage shows what the conversation is about, not how large the demand is. We compared the topic themes carried by coverage of 13 India destination and season terms (hill station, Goa, Kerala, Himachal, Uttarakhand, Rajasthan, Kashmir, Ladakh, Andaman, Sikkim and Meghalaya tourism, Char Dham Yatra and India tourism) in two equal windows: June 2024 to May 2025 (earlier) and June 2025 to May 2026 (recent). News ingest thins after May 2026, so the recent window ends on 31 May 2026. Each article carries topic labels assigned by an automated classifier; a “theme” is one of those labels, and its share is the share of labelled article-mentions that carry it, pooled across the 13 terms. The base was 7,490 labelled mentions in the earlier window and 8,402 in the recent one.
Rising themes.
- Religious travel and pilgrimage (articles on yatras and religious tourism) rose from 2.68% to 4.03% of coverage (+50%).
- Politics (political news touching tourism terms) rose from 1.00% to 1.50% (+50%), but this is within noise once Char Dham coverage is removed.
- Accidents and disasters (accidents, weather disasters and safety) rose from 2.14% to 2.88% (+35%).
- Government and administration (departmental and administrative announcements) rose from 2.24% to 2.98% (+33%).
- Religion and belief (the wider religion label) rose from 6.82% to 8.81% (+29%).
Four of the five rising themes are a Char Dham Yatra effect. Coverage matching “Char Dham Yatra” grew from 1,280 to 2,348 labelled mentions, from 17% to 28% of the pooled base. Without that one term, religion and belief, religious travel, accidents and disasters, and government all fall or stay flat, so we hatch them in the chart. Counting only articles placed in India, mentions of Char Dham Yatra rose from 292 to 574, with 298 in April 2026 alone, the highest month of the 24. The yatra is a seasonal event, so what the news shows is a louder pilgrimage season, not a flatter year.
Falling themes.
- Hotels and accommodation (stays and hotel news) fell from 2.46% to 1.31% (-47%).
- Adventure travel (trekking, rafting and similar activity travel) fell from 1.72% to 1.07% (-38%).
- Hiking and camping fell from 1.32% to 0.82% (-38%).
- Tourist destinations (general) (a catch-all label for destination coverage) fell from 17.78% to 12.89% (-28%).
- Travel guides and travelogues fell from 10.36% to 7.99% (-23%).
These falls hold, at smaller size, when Char Dham is removed (-39%, -29%, -30%, -18% and -14%), so they are not just the pilgrimage story. The generic destinations label is a catch-all bucket, so we treat it as indicative. Counting India-placed articles, “hill station” coverage fell from 1,013 to 652 articles, although overall India news volume did not fall between September 2025 and May 2026.
The vocabulary of seasons is thin in Indian coverage. “Shoulder season” appears in 7 India-placed articles across the 24 months (2 earlier, 5 recent). “Off-season” fell from 65 to 49, “tourist season” from 96 to 82, and “peak season” rose from 53 to 87. Coverage of leisure destinations and guides is shrinking in share while coverage of the pilgrimage season, safety and administration grows. That fits a calendar in which one season gets louder rather than the year levelling out, but the news data do not prove it.
The numbers side by side
| Trip type | Searches | Baseline peak months | Peak-to-trough, before | Peak-to-trough, recent | Peak-month share, before | Peak-month share, recent | Change (points, 95% interval) |
| Hill station | 8 | Apr, May, Jun | 1.73 | 1.70 | 33.5% | 32.3% | -1.2 (-2.0 to -0.4) |
| Snow and high altitude | 7 | Apr, May, Jun | 1.84 | 2.10 | 33.4% | 30.0% | -3.4 (-5.0 to -2.1) |
| Beach | 6 | Nov, Dec, Jan | 1.36 | 1.52 | 28.2% | 30.6% | +2.4 (+0.5 to +4.4) |
| Wildlife | 6 | Nov, Dec, Jan | 1.37 | 1.40 | 28.5% | 28.7% | +0.2 (-0.7 to +1.1) |
| Heritage and desert | 6 | Oct, Nov, Dec | 1.49 | 1.58 | 29.8% | 31.0% | +1.2 (+0.2 to +2.2) |
| Pilgrimage | 6 | May, Jun, Jul | 1.96 | 2.11 | 35.9% | 33.8% | -2.1 (-4.4 to 0.0) |
| Monsoon and backwater | 6 | Jun, Jul, Aug | 1.78 | 1.62 | 33.4% | 32.2% | -1.2 (-2.7 to +0.2) |
| General trip planning | 6 | Dec, Apr, May | 1.33 | 1.37 | 28.2% | 27.5% | -0.7 (-1.1 to -0.4) |
| All 51 searches | 51 | n/a | 1.37 | 1.36 | n/a | n/a | n/a |
Before = October 2016 to September 2019 (three travel years); recent = October 2022 to September 2026 (four). A year with no seasonality would give a peak-month share of 25% and a ratio of 1.00. Search interest is relative, not a count of searches.
What to take from it
For readers planning a trip: the data describe attention, and a busy search month is not a measure of crowding. Winter has become a bigger moment for mountain, snow and beach searches, and the summer mountain peak, though still the highest for hill stations, is a little smaller. For operators and destination managers: a bet on “flatter seasons” would not be supported by this record, and neither would an assumption that the old calendar is unchanged. Two things are more consistent in the data than any flattening: the peaks are still there, and December is carrying more weight than it did before the pandemic. For researchers and editors: the missing piece is monthly domestic visit data, which the official tables we used do not provide. A monthly state-level series would let the search signal be tested against visits. A 2027 reading will need the October 2026 to September 2027 travel year, which can be added to the same method.
Method note and limitations
Data and analysis. The news, search and research-paper analysis in this article was run with Fliar Prism (Fliar Business Intelligence, 2026a), and the research tools it uses are published as the open-source Prism MCP (Fliar Business Intelligence, 2026b).
Search interest. Search interest is a relative index from search-volume data for India, monthly from January 2016 to September 2026. It is not a count of searches. Each of the 51 searches was requested on its own, so its index runs from 0 to 100 against its own highest month; we divided each year by its own average and averaged the searches within a trip type. This shows when interest peaks, not how large it is. A longer series makes the index lean on its all-time peak, so ratios are computed within each travel year. The 51 searches were chosen as well-known destination and planning terms, six to eight per type. A different set would change the numbers, and the intervals (4,000 resamples of the searches) reflect that. They do not cover other sources of uncertainty, such as how the index is sampled.
Periods. Three travel years before the pandemic and four recent ones, October to September. 2022-23 includes some recovery effects. We left out 2019-20 to 2021-22. A search-interest trend can also reflect changes in how people search (more app use, different spellings), which this analysis cannot separate from changes in travel.
State map. State series use three planning searches among people in each state; eight states and union territories had too little data, and island territories were not queried. The map shows where searchers live, not where they travel. Ladakh is drawn within Jammu and Kashmir. Boundaries follow India’s official outline (Survey of India, no date).
Top 25 searches. A candidate set of about 35 searches was linked through one anchor search and rounded to whole points, so values are approximate (about plus or minus 10%), and the least certain are labelled in the chart. Absolute monthly volumes were not available from the sources we could use, so every search figure here is relative.
News. Counts and themes come from news and blog articles. Counts of mentions use a mention match, so a term can over-count (names that are also common words), and the India-placed counts use the place an article is about. The theme comparison uses two 12-month windows (1 June 2024 to 31 May 2025, and 1 June 2025 to 31 May 2026), pooled over 13 terms, so an article that matches two terms counts twice. Only each term’s 80 highest-ranked labels were returned, so small themes may be undercounted. A two-proportion test with 2.0 as the cut-off flags noise, and it treats mentions as independent, which flatters significance because articles repeat across outlets. Pooled shares depend on which terms are included: adding Manali, Munnar and Darjeeling, which also match other meanings, changed the political and government themes sharply, so we left them out.
Official data. Foreign arrivals and departures are the Ministry’s monthly tables for 2019, 2023 and 2024 (Ministry of Tourism, 2025). Domestic visits are annual only.
Not delivered from the original pitch. The pitch listed customer reviews, absolute search volumes and drawings; none of these is included. Reviews could not be sourced for destinations in a form that could be analysed by month, search volumes are given as a relative index, and charts and a map are provided in place of drawings. Crowding was not measured directly. Geo intelligence is limited to the state map of searchers and does not locate destinations.
References
Eurostat (no date) Seasonality in tourism demand [Statistics Explained]. Available at: https://ec.europa.eu/eurostat/statistics-explained/index.php?title=Seasonality_in_tourism_demand (Accessed: 27 October 2026).
Fliar Business Intelligence (2026a) Fliar Prism: news, search and research-paper analysis [Data and analysis platform]. Available at: https://fliarbi.com/prism/ (Accessed: 27 October 2026).
Fliar Business Intelligence (2026b) Prism MCP: open-source research tools [Software]. GitHub. Available at: https://github.com/fliarbi/prism-mcp (Accessed: 27 October 2026).
India Meteorological Department (no date) Frequently asked questions on monsoon. Available at: https://mausam.imd.gov.in/imd_latest/monsoonfaq.pdf (Accessed: 27 October 2026).
Ministry of Tourism, Government of India (2025) India Tourism Data Compendium 2025. Available at: https://data.tourism.gov.in/mrd/Uploads/tourism_data/India%20Tourism%20Data%20Compendium%202025_1.pdf (Accessed: 27 October 2026).
Survey of India (no date) Survey of India. Available at: https://surveyofindia.gov.in/ (Accessed: 27 October 2026).